Description
Replication-competent Lentivirus (RCL) Detection Kit is used to quantitatively detect replicating lentiviruses that may occur in a variety of cell products associated with lentiviral vectors potential risks.
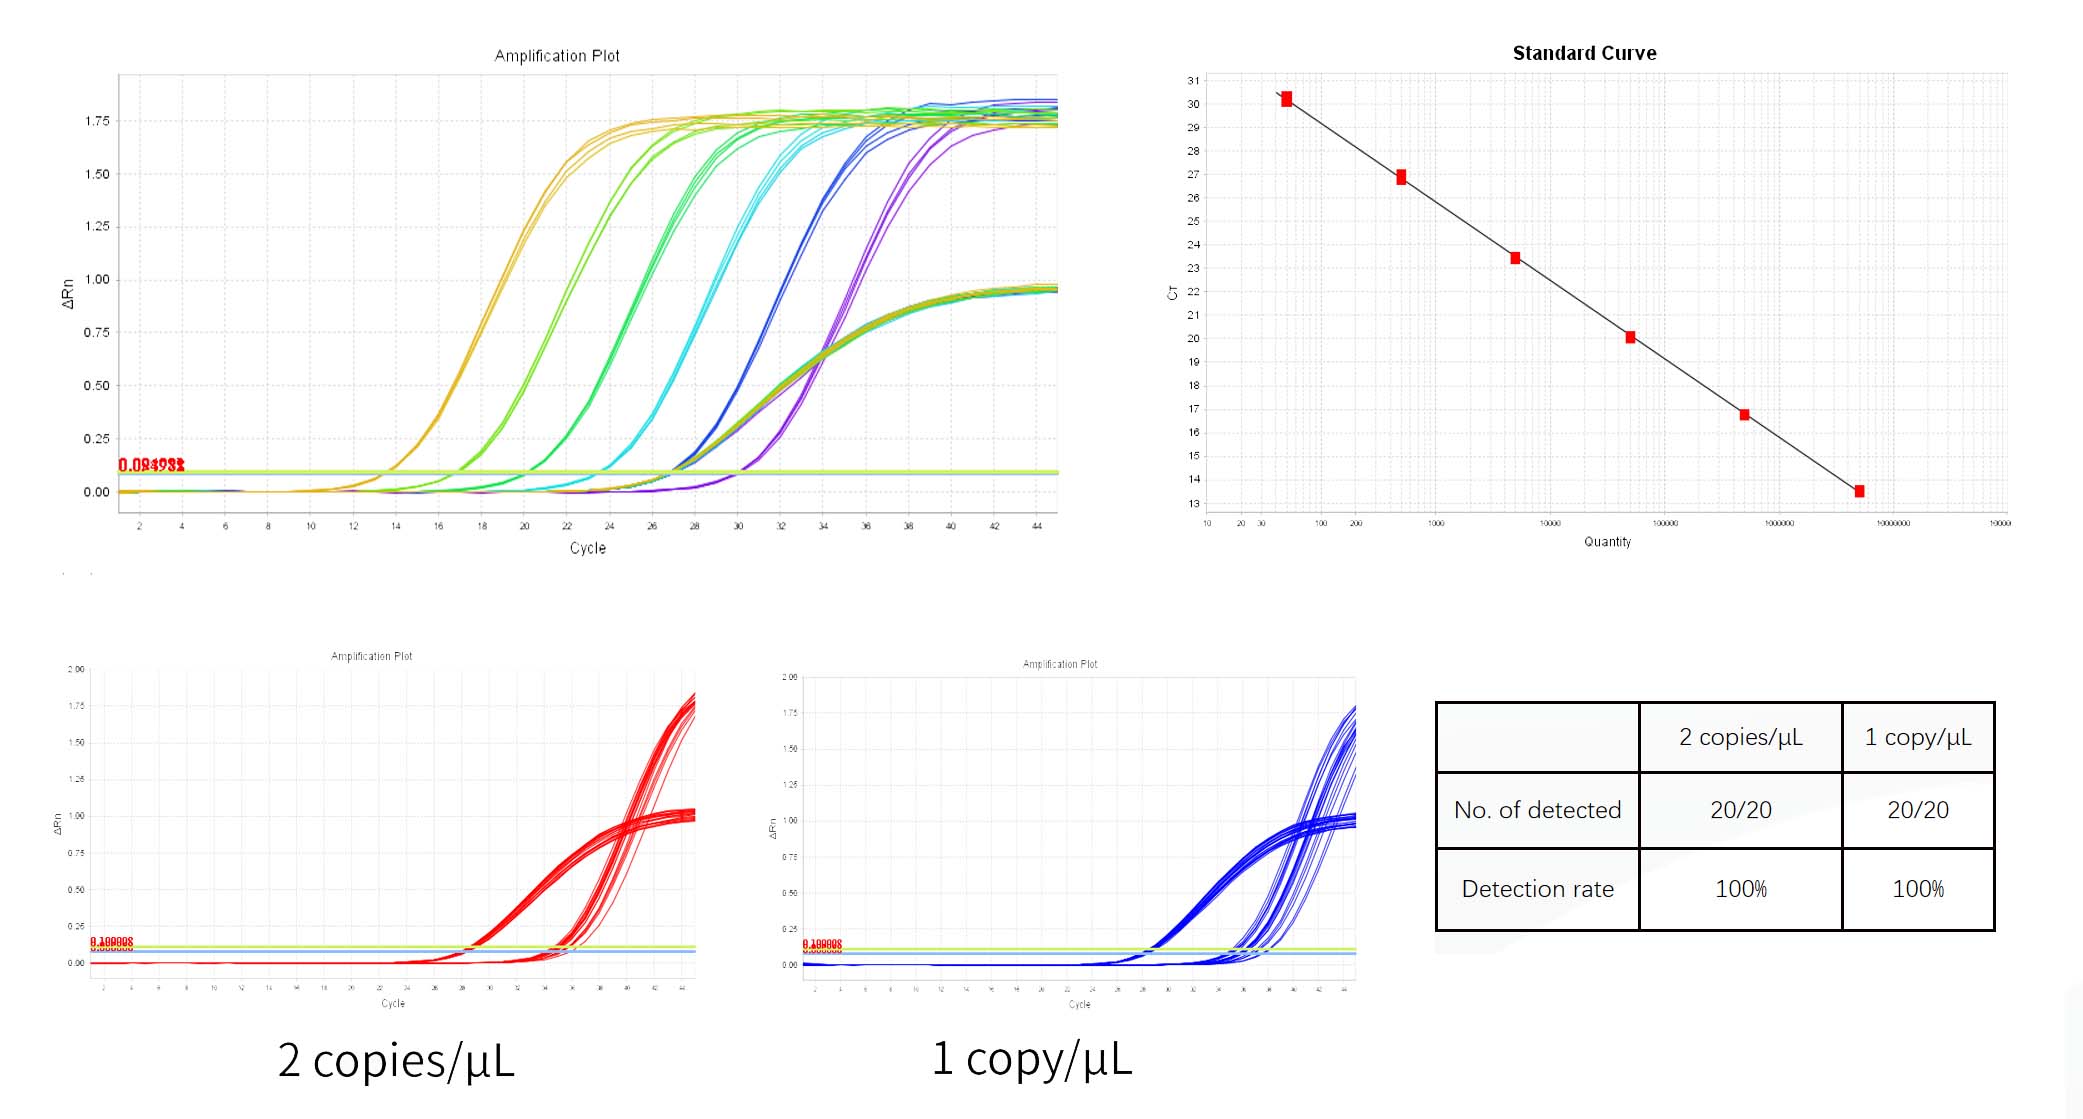
This kit designs specific primers for the VSV-G gene sequence of lentiviral envelope proteins. And it adopts taqman fluorescent probe and the polymerase chain reaction (PCR) method, which has 1 copies/μL level detection limit and can specifically and quickly detect the replication-competent lentivirus risk. The kit needs to be used together with the the Residual DNA Sample Preparation Kit (Cat# 18461ES).
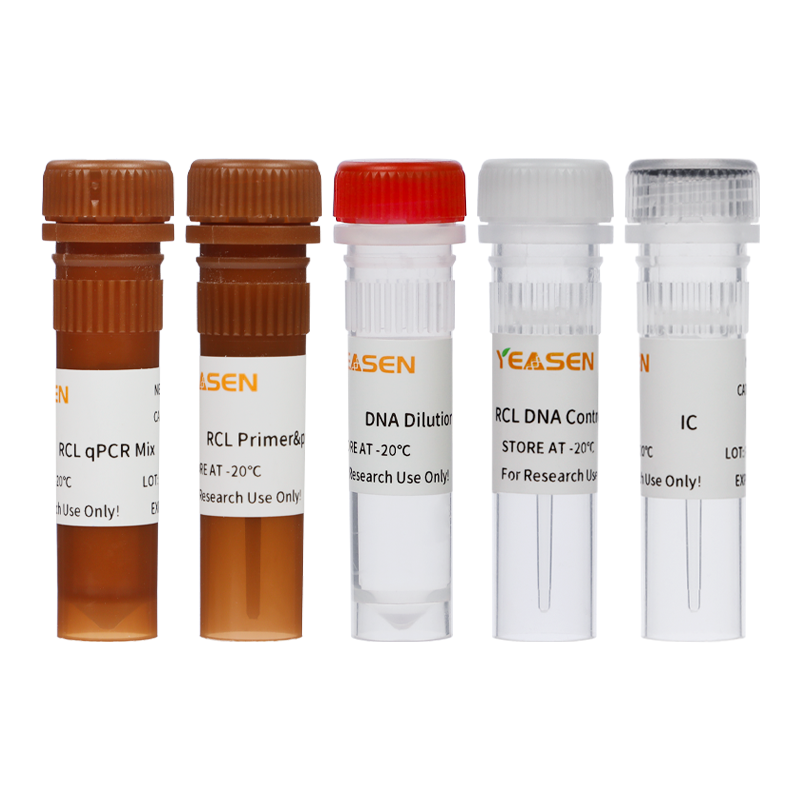
Components
|
Components No. |
Name |
41311ES50 |
41311ES60 |
|
41311-A |
RCL qPCR Mix |
0.75 mL |
1.5 mL |
|
41311-B |
RCL Primer&Probe Mix |
200 μL |
400 μL |
|
41311-C |
DNA Dilution Buffer |
2×1.8 mL |
4×1.8 mL |
|
41311-D |
RCL DNA Control(5×10E8 copies/μL)) |
25 μL |
50 μL |
|
41311-E |
IC* |
50 μL |
100 μL |
* IC: Internal control.
Storage
This product should be stored at -25~-15℃ for 2 years.
Both 41311-A and 41311-B should be stored protected from light.
Applicable instrument models
Include but not limited to: Bio-Rad: CFX96 Optic Module; Thermo Scientific: ABI 7500; ABI Quant Studio 5; ABI Step OnePlus.
Instructions
- RCL DNA Standard dilution and Standard curve preparation
The RCL DNA Control was gradient diluted using the DNA Dilution Buffer provided in the kit* , and the dilution concentration is 5×10E7 copies/μL, 5×10E6 copies/μL, 5×10E5 copies/μL, 5×10E4 copies/μL, 5×10E3 copies/μL, 5×10E2 copies/μL, 5×10E1 copies/μL.
See detailed instructions below:
1) Thaw the RCL DNA control and DNA dilution buffer on ice. After completely thawed, vortex gently to mix, and centrifuge at low speed for 10 secs.
2) Take out seven clean 1.5 mL tubes, marked with Std0, Std1, Std2, Std3, Std4, Std5, Std6.
3) Add 90 μL of DNA dilution buffer and 10 μL of RCL DNA Control to the 1.5 mL microfuge tube labeled Std0, namely dilute to 5×10E7 copies/μL. Mix and then centrifuge for 10 secs. Subpackage the diluted DNA standard and it can be stored in the short term (no more than 3 months) at -25~-15℃** .Please avoid repeated freeze-thaw.
4) Add 90 μL of DNA dilution buffer into other tubes*** , then follow the below procedure for the serial dilutions**** .
|
Tube |
Dilution Ratio |
Standard concentration |
|
Std1 |
10 μL Std0 + 90 μL DNA Dilution Buffer |
5×10E6 copies/μL |
|
Std2 |
10 μL Std1 + 90 μL DNA Dilution Buffer |
5×10E5 copies/μL |
|
Std3 |
10 μL Std2 + 90 μL DNA Dilution Buffer |
5×10E4 copies/μL |
|
Std4 |
10 μL Std3 + 90 μL DNA Dilution Buffer |
5×10E3 copies/μL |
|
Std5 |
10 μL Std4 + 90 μL DNA Dilution Buffer |
5×10E2 copies/μL |
|
Std6 |
10 μL Std5 + 90 μL DNA Dilution Buffer |
5×10E1 copies/μL |
Table1 Standard gradient dilution
*Three replicate wells are required for each concentration.The detection range is 5×10E1 copies/μL~5×10E6 copies/μL and this range can be expanded if required.
** To reduce the number of repeat freeze-thaw and avoid contamination, it is recommended to store the DNA control in aliquots at -25~-15℃ for the first time.
*** Once thawed, DNA dilution buffer could be stored at 2-8°C for 7 days, if not used for a long time, please store at -25~-15℃ .
**** Make sure the template is completely mixed, gently shake the mixture for 15 secs to 1 min for each gradient dilution.
- Extraction Recovery Control (ERC) preparation
Set the concentration of RCL DNA in ERC as needed (the ERC sample was prepared with 5×10E4 copies RCL DNA as an example), as follows:
1) Add 100 μL test sample into a clean 1.5 mL tube, then add 10 μL 5×10E3 copies/μL RCL DNA Standard (Std4) and mix well, marked as ERC.
2) Perform the DNA extraction of ERC sample together with the test samples to prepare the purified ERC sample.
- Negative Control Solution (NCS) preparation
Set the negative control in the experiment, the specific operation steps are as follows:
1) Add 100 μL sample matrix (or DNA dilution buffer) into a clean 1.5 mL tube, then marked as NCS.
2) Perform the DNA extraction of NCS sample together with the test samples to prepare the purified NCS sample.
- No Template Control (NTC) preparation
Set the no template control in the experiment, the specific operation steps are as follows:
1) NTC requires no sample pretreatment, and can be configured at the stage of qPCR detection of residual DNA content.
2) The NTC sample in each tube or well is 20 μL Mix (i.e. 15 μL RCL qPCR Mix + 4 μL RCL Primer&probe Mix + 1 μL IC) + 10 μL DNA Dilution Buffer. It is recommended to configure three replicate wells.
- PCR reaction system
|
Component |
Volume(μL) |
|
RCL qPCR Mix* |
15 |
|
RCL Primer&Probe Mix |
4 |
|
IC |
1 |
|
DNA Template |
10 |
|
Total volume** |
30 |
Table2 Reaction system
* Calculate the total PCR reaction volume by the number of reactions: qPCR Mix =(the number of reactions+2) × (15+4+1) μL (including the losses of two reaction wells). More than three replicates for each sample are recommended in the experiment.
** After capping the tube or sealing the plate, centrifuge the reaction tube or plate at low speed for 10 secs. After sufficient shaking and mixing for 5 secs, repeat centrifuge to collect the liquid from the lid or wall to the bottom. Avoid bubbles during operation.
See below table for the recommended Plate setup:
|
|
1 |
2 |
3 |
4 |
5 |
6 |
7 |
8 |
9 |
10 |
11 |
12 |
|
A |
NTC |
|
TS 1 |
TS 1 |
TS 1 |
|
Std 1 |
Std 1 |
Std 1 |
|
|
|
|
B |
NTC |
|
TS 2 |
TS 2 |
TS 2 |
|
Std 2 |
Std 2 |
Std 2 |
|
|
|
|
C |
NTC |
|
TS 3 |
TS 3 |
TS 3 |
|
Std 3 |
Std 3 |
Std 3 |
|
|
|
|
D |
|
|
|
|
|
|
Std 4 |
Std 4 |
Std 4 |
|
|
|
|
E |
NCS |
|
ERC 1 |
ERC 1 |
ERC 1 |
|
Std 5 |
Std 5 |
Std 5 |
|
|
|
|
F |
NCS |
|
ERC 2 |
ERC 2 |
ERC 2 |
|
Std 6 |
Std 6 |
Std 6 |
|
|
|
|
G |
NCS |
|
ERC 3 |
ERC 3 |
ERC 3 |
|
|
|
|
|
|
|
|
H |
|
|
|
|
|
|
|
|
|
|
|
|
Table3 Computer-on reference board
The plate layout includes: 6 Std (the standard curve of 6 standard concentrations), 1 NTC (no template control), 1 NCS (negative control solution), 3 TS (test samples), 3 ERC (extraction recovery control). Three replicate wells for each sample.
- Setup guidelines for a PCR Instrument
The following instructions apply only to Thermo ABI 7500 qPCR instrument (Software version 2.0). If you use a different instrument, refer to the applicable instrument guide for setup guidelines.
1) Generate a new experiment, choose the template of absolute quantification or user-defined.
2) Create 1 detection probe, named "RCL-DNA", select reporter fluorophore as "FAM" and quench fluorophore as "none"; create 1 more detection probe, name "IC" and select the reporter fluorophore as "CY5" and quenching fluorophore as "none". The reference fluorescence is ROX" (the reference fluorescence can be based on the instrument model, etc., select whether you need to add it).
3) In the ‘Samples’ pane, add all the samples information in turn. Then select the wells, choose the target and the samples correspondingly. Set the task of RCL DNA standard as standard, and assign the values 5000000, 500000, 50000, 5000, 500, 50 (the unit of DNA concentration in each well is copies/μL) in the Quantity column, and name the wells Std 1, Std 2, Std 3, Std 4, Std 5, Std 6, correspondingly. Set the task of NTC as NTC. Set the NCS, TS, and ERC as Unknown, and named them according to the above Plate layout correspondingly. Then click next.
4) Set the amplification program: set the reaction volume as 30 μL.
|
Cycle Step |
Temperature(℃) |
Time |
Cycles |
|
Contaminated digestion |
37℃ |
5 min |
1 |
|
Initial denaturation |
95℃ |
5 min |
1 |
|
Denaturation |
95℃ |
15 sec |
45 |
|
Annealing/Extension(Fluorescence collection) |
60℃ |
30 sec |
Table4 Amplification procedure
- Analysis of qPCR results
1) The system will automatically give the Threshold In the Amplification Plot panel of Analysis. The Threshold given by the system is too close to the baseline sometimes, resulting in a large difference in Ct between replicate wells. You can manually adjust the Threshold to an appropriate position and click Analyze. Then you can initially check whether the amplification curve is normal in Multicomponent Plot.
2) In the Result Analysis tab, review the Standard Curve plot. Verify the values for the R2, Efficiency, Slope and Y-intercept. For a normal standard curve, R²>0.99, 90%≤Eff%≤110%, -3.6≤Slope≤-3.1.
3) In the ‘View well table’ pane in Analysis, the concentrations of each samples are showed in Quantity, the unit is copies/μL, the units can be convert in the assay report.
4) The parameter settings of the result analysis need to be based on the specific model and the software version used, and can generally be automatically interpreted by the instrument.
5) Calculate the spike recovery rate based on the test results of the sample TS to be measured and the sample spike recovery ERC, the recovery rate of spikes is required to be between 50%~150%.Spiked recovery rate meter formula:
Recovery (%) = {Sample spiked assay (eg.copies/μL) - Sample assay (eg.copies/μL)} x Elution volume (μL) / Theoretical value of DNA addition amount (eg.copies) x 100%。
6) The Ct value of the negative control NCS should be greater than the mean of the lowest concentration Ct of the standard.
7) Template free control NTC should be Undetermined or Ct value ≥38.
Notes
- This product is for research use only.
- Please operate with lab coats and disposable gloves, foryour safety.
3.Please read this manual carefully before using this reagent, and the experiment should be standardized, including sample handling, reaction system preparation and sample addition.
4.Ensure that each component is fully vortexized and centrifuged at low speed before use.
Payment & Security
Your payment information is processed securely. We do not store credit card details nor have access to your credit card information.
Inquiry
You may also like
FAQ
The product is for research purposes only and is not intended for therapeutic or diagnostic use in humans or animals. Products and content are protected by patents, trademarks, and copyrights owned by Yeasen Biotechnology. Trademark symbols indicate the country of origin, not necessarily registration in all regions.
Certain applications may require additional third-party intellectual property rights.
Yeasen is dedicated to ethical science, believing our research should address critical questions while ensuring safety and ethical standards.


